

An inventory management dashboard is supposed to make stock decisions faster, not slower. But most of the ones we see inside Canadian SMBs do the opposite. They look beautiful, they pull from three different sources, and they're wrong by 9 a.m. Monday.
The problem almost never lives in the dashboard itself. It lives in the data underneath, the KPIs that got picked because they were easy to display, and the fact that nobody asked who the dashboard was actually for.
This guide walks through what a good inventory management dashboard should show, where the data needs to come from, and how to build one your operations team will actually open every morning.
Inventory Visibility Worth Trusting
Get a clearer picture of what your stock data is really telling you, with help from a team that has rebuilt dashboards for distributors, manufacturers, and retailers across Canada.
 Book a free consultation
The 8 KPIs Your Inventory Management Dashboard Should Track
Pick too many KPIs and the screen becomes wallpaper. Pick the wrong ones and the team makes confident decisions on weak data. These eight are the ones we see actually moving the needle.
1. Inventory Turnover Ratio
Turnover tells you how many times your stock cycles through in a year. A ratio of 6 means you sold and replaced your entire inventory six times. Low turnover usually means you're holding too much capital in slow-moving items. High turnover with frequent stockouts means you're under-ordering.
The right target depends on your industry. Grocery aims for 10 to 15. Fashion and apparel sit closer to 4 to 6. Without this number on the dashboard, every other inventory KPI is missing context.
2. Days Sales of Inventory
Days sales of inventory, or DSI, converts turnover into something more intuitive. It tells you the average number of days a unit sits on the shelf before selling. A DSI of 60 means it takes two months to move stock. For most distributors and product businesses, lower is better, but watch the trade-off.
Pushing DSI too low usually means smaller buys, higher freight costs, and more stockouts. The dashboard view that matters is the trend line over months, not the single number.
3. Stockout Rate
Stockout rate measures how often you ran out of a SKU that customers wanted. A 5% stockout rate means one in every 20 customer orders hit an empty bin.
This metric has a direct line to lost revenue and customer trust, which is why it belongs on the inventory management dashboard at the top, not buried under a tab. Track it by SKU, by location, and by month. The pattern usually points straight at a forecasting or supplier issue.
4. Carrying Cost of Inventory
Carrying cost is what it actually costs you to hold a unit of stock. Warehousing, insurance, depreciation, capital tied up, shrinkage, all of it. Most teams underestimate this number by half.
A realistic carrying cost for SMBs sits between 20% and 30% of inventory value per year. Once it's on the dashboard, the case for clearing slow-moving stock writes itself. Without it, finance and operations argue about the same item from two different financial realities.
5. Inventory Accuracy
Inventory accuracy compares what the system says you have against what's actually on the shelf. World-class is 97% or above. Most SMBs sit between 80% and 90% and don't know it until the annual count.
Putting accuracy on the inventory management dashboard, broken down by location and updated through cycle counts, forces the conversation. Low accuracy quietly poisons every other number on the screen. Forecasts, reorder points, even revenue reporting all lean on a stock count nobody verified.
6. Sell-Through Rate
Sell-through rate is the percentage of units sold versus units received in a given period. A 70% sell-through over a month means 30% of what you bought is still sitting there.
For seasonal businesses, fashion, and short-shelf-life products, this is the most important early warning signal you have. Combined with turnover, it tells you whether buying is aligned with demand. The dashboard view should let buyers filter by category, supplier, and season.
7. Backorder Rate
Backorder rate captures customer orders you accepted but couldn't ship from stock. A high rate isn't always bad, especially for made-to-order or configured products. But for distributors and retailers, it points to either a forecasting miss or a supplier reliability issue.
Tracking this on the inventory management dashboard alongside stockout rate gives you the full picture of "demand we couldn't serve immediately." That distinction matters when leadership asks why service levels dropped.
8. Gross Margin Return on Investment
GMROI is the metric that translates inventory into profit language. It tells you how much gross margin you earned for every dollar invested in inventory. A GMROI of 3 means three dollars of margin for every dollar tied up in stock. This is the number your CFO actually cares about.
Putting it on the inventory management dashboard, segmented by category and supplier, ends the recurring debate between "we need to hold more" and "we have too much cash in the warehouse."
Where the Data on Your Inventory Management Dashboard Should Come From
Your inventory management dashboard should pull from a single source-of-truth system that posts every inventory transaction as it happens. For most Canadian SMBs, that's an ERP like Microsoft Dynamics 365 Business Central. The dashboard reads from that one clean dataset, not from a patchwork of spreadsheets and exports.
Why Spreadsheet-Fed Dashboards Lie
A dashboard is a window. The view depends entirely on what's behind the glass. Most failed dashboards trace back to the data layer, not the visualization tool. Spreadsheets, disconnected accounting software, manual exports, all of these create a dashboard that looks confident but lies quietly.
If your inventory still lives in Excel across multiple files and people, you already know the symptoms. Our breakdown of why Excel struggles as inventory grows walks through the data-traceability and real-time-update gaps that make spreadsheet-fed dashboards unreliable. Excel has no real-time sync, no audit trail, and no clean way to share live data across departments, which is exactly what a dashboard needs.
ERP-Powered Inventory Management Dashboard Setups
An ERP-powered inventory management dashboard works differently. The data is posted once, in one place, and every screen reads from that same source.
In Microsoft Dynamics 365 Business Central, inventory transactions, valuation, and movement are recorded as they happen. The dashboard, whether it's a native Role Center, an Analysis Mode view, or a Power BI report layered on top, pulls from clean data without any manual export step. That's the difference between a number you trust at 9 a.m. Monday and a number you have to verify before sharing.
For a closer look at how the ERP layer actually changes inventory operations, our guide on ERP software for inventory management covers centralization, real-time updates, and demand forecasting in more detail. Most of what you need is in this article, so the link is for readers who want to go deeper on the ERP side of the equation.
Stop Guessing About Your Stock
See what real-time inventory visibility looks like inside Business Central, configured for your products, locations, and reporting cadence.
 Book a free consultation
Who Should Be Looking at Your Inventory Management Dashboard
Most teams build one dashboard and try to make it serve everyone. That's why nobody uses it. A useful inventory management dashboard splits into three views, each tied to a real role and decision rhythm.
The Daily Operations View
This is what the warehouse manager and inventory coordinator open every morning. It shows what shipped yesterday, what's expected in today, current stockout SKUs, and items below reorder point.
The time horizon is short. The action is concrete. Nobody on the floor needs a quarterly trend chart at 7 a.m. They need to know which 12 SKUs to chase before lunch.
The Weekly Buying and Planning View
The buyer or planner opens this view once a week. It shows sell-through rate by category, current weeks of supply, supplier on-time performance, and reorder recommendations.
The decisions here are about what to buy, how much, and from whom. The inventory management dashboard at this level should let them filter by season, supplier, and product family without exporting to Excel first.
The Monthly Finance View
Finance cares about inventory as capital. This view shows total inventory value, carrying cost, slow-moving stock dollars, GMROI by category, and write-down exposure. It feeds the month-end close and the cash-flow conversation.
When this view lives on the same inventory management dashboard as operations and buying, finance stops chasing the warehouse team for numbers, and the warehouse stops being surprised by accounting questions.
5 Mistakes That Wreck an Inventory Management Dashboard
We've audited a lot of inventory management dashboard builds inside SMBs across Canada. The same five problems show up over and over, and most of them are fixable in a quarter.
1. Treating It Like a Report Instead of a Decision Tool
If nobody can name the decision a metric drives, the metric doesn't belong on the screen. Reports are for the record. Dashboards exist to trigger action, and that distinction usually decides whether anyone opens them after week one.
2. Tracking Too Many KPIs at Once
Once you cross 10 or 12 metrics on a single view, attention scatters. The team picks two numbers they like and ignores the rest. A focused dashboard with eight well-chosen KPIs almost always outperforms a busy one with twenty.
3. Mixing Data Sources Without Reconciling Them
Sales from the e-commerce platform, inventory from a separate WMS, and finance from accounting software almost never agree at the unit level. A dashboard built on top of three disconnected systems will always show three different truths, and the team will end up trusting none of them.
4. Leaving the Dashboard Without an Owner
A dashboard with no owner gets stale within a quarter. SKUs get added, locations change, suppliers churn, and the screen slowly drifts out of sync until people stop trusting it. One named owner per dashboard is the cheapest fix on this list.
5. Building It Once and Never Updating It
The KPIs that mattered in year one of growth are not the ones that matter in year three. Without a quarterly review of what's on screen, the inventory management dashboard becomes a relic. Put the review on the calendar the same way you'd schedule a stock count.
Build Smarter ERP Decisions
Compare what to look for in an ERP before you commit to a system that your dashboard will live on top of for the next decade.

How to Choose an Inventory Management Dashboard Tool
There are three real options, and the right fit depends mostly on what's already in your stack. Here is how the three compare in practice.
Native ERP Dashboards Built Into Business Central
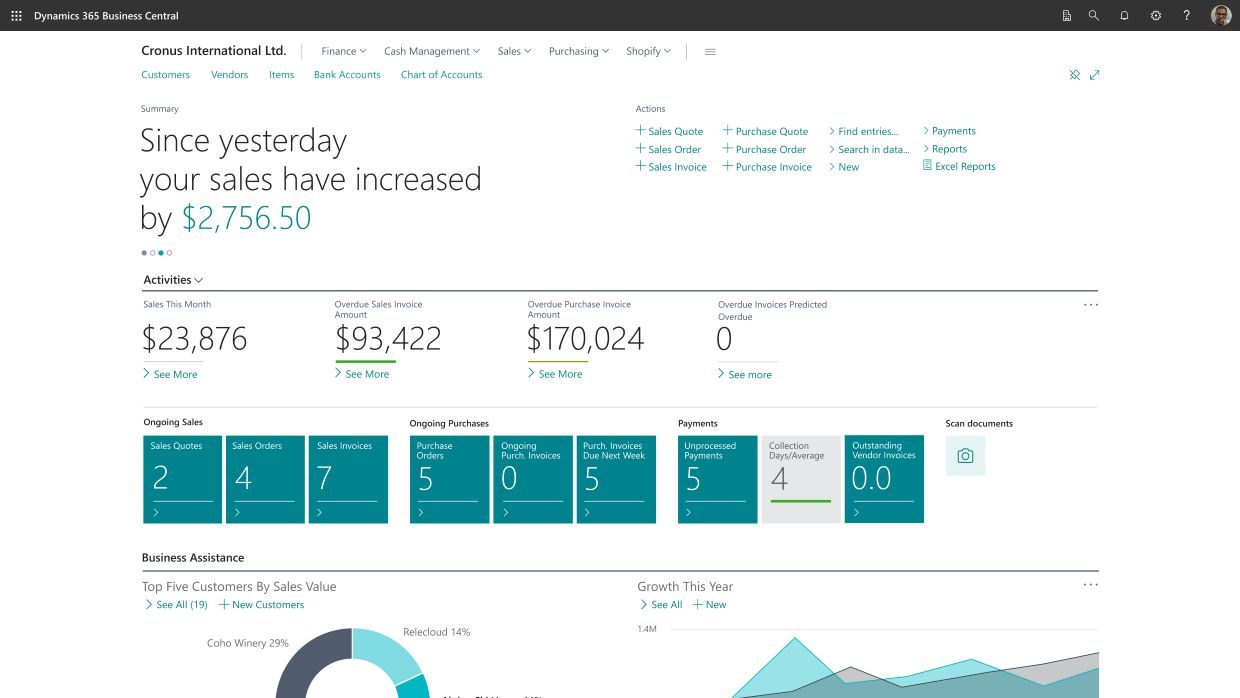
Business Central includes Role Centers, FactBoxes, and Analysis Mode out of the box. For most SMBs, that's already 70% of what they need. No external tool, no extra licensing layer, no manual data export job.
The trade-off is design flexibility. Native views are functional, not flashy, but they read straight from the same system that posts every transaction, so the numbers stay current without any reconciliation step.
Power BI Layered on Top of Your ERP
Once you need cross-departmental views, multi-source data, or visualizations the native screens can't deliver, Power BI is the natural next step. It plugs directly into Business Central data and lets you build views that combine inventory, sales, and finance in one screen.
Our look at how a sales performance dashboard built in Power BI lives or dies on the underlying data applies almost word-for-word to inventory. The visualization tool is the easy part. The data plumbing is what makes or breaks it.
Standalone Dashboard Tools Like Geckoboard or Glide
Geckoboard, Knack, Glide, and similar tools sit outside the ERP and pull from whatever you connect to them. They look polished and ship fast. The hidden cost shows up later, when your data lives in two places and reconciliation becomes someone's part-time job. For SMBs that already run on Business Central, standalone dashboard tools rarely earn their seat.
-
An inventory management dashboard is a visual screen that shows live stock data and the KPIs tied to it. It usually pulls from an ERP, WMS, or accounting system and displays metrics like stock levels, turnover, stockouts, and inventory value. The goal is to turn raw inventory data into decisions for warehouse, buying, and finance teams.

Why Gestisoft Is the Right Partner for Your Inventory Management Dashboard
Gestisoft has spent more than 25 years implementing Microsoft Dynamics 365 Business Central and CRM across Canada and North America. We work with SMBs in manufacturing, distribution, and fashion and apparel, in English and in French. As a certified Microsoft Solutions Partner, we focus on the part most teams skip: getting the data right before anyone builds a screen on top of it.
Our approach to an inventory management dashboard starts with the source system. We map what data your operations, buying, and finance teams actually need, configure Business Central to capture it cleanly, and then layer Power BI on top when the use case calls for it. That sequence is why our clients trust the numbers they see.
One of our manufacturing clients put it this way:
“The solution delivered to us has significantly improved our production visibility. We are now able to track our production in real time, and have more accurate data on the costs of each production run.”
If that kind of visibility sounds like the gap in your current setup, the next step is short.
Get a Dashboard Your Team Actually Uses
Talk to a Gestisoft consultant about connecting your inventory data, ERP, and Power BI into one source of truth your operations team will open every morning.
 Book a free consultation
Liked what you just read? Sharing is caring.

June 16, 2026 by Muhammad Ali Iqbal by Muhammad Ali Iqbal SEO Content Strategist & Copywriter
Driven by a passion for search engine optimization, strategic content, and conversion-focused writing. A copywriter and content strategist who lives for content that ranks, engages, and delivers real business results.
