
As a marketing director, data is undoubtedly the base of all your actions. There’s no day that passes that you don’t look at it. It’s the measure of almost everything
However, you probably often feel like you’re swimming without a lifejacket in an infinite sea of data that spreads out to the 4 corners of the world. Do you sometimes feel like you’re sinking in all this data?
That happens to a lot of our clients. This is why we decided to look into a more efficient way to unify all the important and useful data for any good member of a marketing team. Dynamics 365 offers a lot of data, so it can be connected with several tools that also generate a lot of numbers, and you don’t have any time to lose.
The solution? A Daily Marketer Dashboard in Microsoft Dynamics 365 gives you the straight facts on a daily basis. What is a Daily Marketer Dashboard? How do you set one up? Read on to find out!
What’s a dashboard in Microsoft Dynamics 365?
A dashboard is a one-stop shop for all the important information in your work. It’s an interface in Microsoft Dynamics 365 that gathers all the crucial charts and stats that you need to evaluate how you are progressing with your goals and what actions you need to take to reach those objectives.
You or your manager set goals, and we all know that those are not suggestions. They are achievable and reachable, and you must do everything in your power to meet them. In short, a dashboard is what you’ll find behind the wheel in your car: data about gas, speed, performance, lights, etc. With a glance you can verify if you are ok or heading for a crash, and that is exactly what a Daily Marketer dashboard in Microsoft Dynamics 365 will bring to your routine.
Who’s the Daily Marketer dashboard in Microsoft Dynamics 365 for?
So, who will use it? Clearly, no salesperson needs it. But your marketing team? Most definitely. So before even thinking about creating a dashboard, the rule of thumb is to think about who will use it on a daily basis.
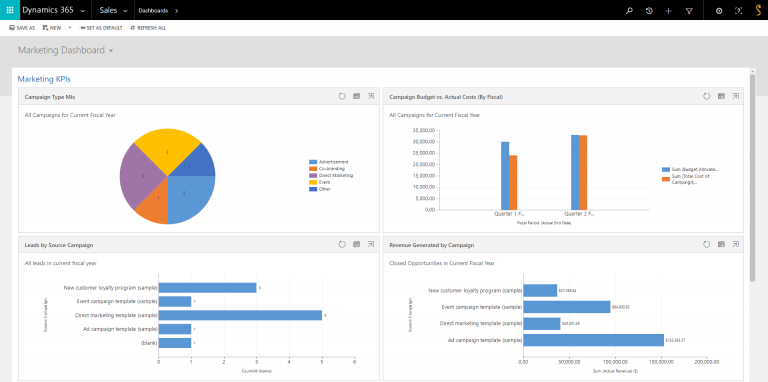
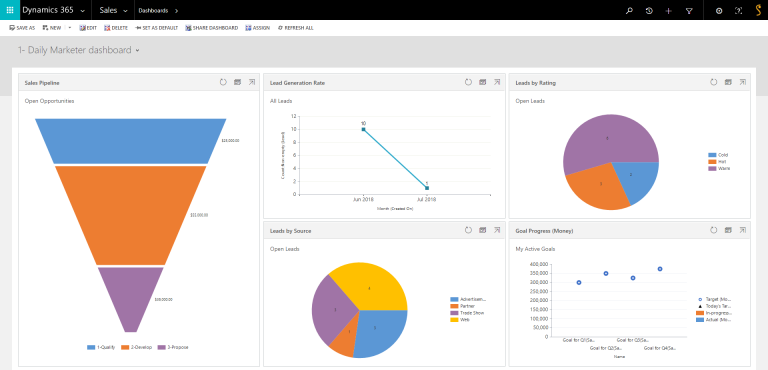
When creating a Daily Marketer Dashboard in your Microsoft Dynamics 365, keep in mind that your marketing team should be able to see conversation rates, lead generation, and your overall performance, especially if you have a specific goal. This is why we’ve collected all the charts you must have on hand every day to instantly answer pressing questions.
Overall, the Daily Marketer dashboard in Microsoft Dynamics 365 should help you get a clear answer when you’re wondering about:
- Lead generation
- Funnel performance
- Conversion rate and timeline
- Lost leads
Having a Daily Marketer dashboard in Microsoft Dynamics 365 not only gives you an overview of your performance and your team’s performance, but it’s also there to reveal unexpected opportunities, missed leads, and other stats that will help you get your business off the ground and grow it beyond your wildest dreams.
A Daily Marketer dashboard in Microsoft Dynamics 365 is the place where you will get answers and a detailed course of action. No more wondering or guessing. You’ll instantly get the information you need to make decisions.
How to create the Daily Marketer dashboard in Microsoft Dynamics 365
By now, you must be wondering how to create a marketer dashboard in Microsoft Dynamics 365? It’s not complicated, actually.
Before doing anything, you should consider your goal and the KPI you want to track according to this objective. So, for example, if you want a daily marketer dashboard, you should look for a dashboard that gives you a daily update on your team’s performance and lead generation. That’s your goal. Now, the key performance indicators that you should add to your marketer dashboard should be something like:
- Lead Generation VS Goal
- Lead Source
- Case by priority
- Landing page interactions
- Sales Ready Leads
Want to learn more about creating a dashboard? Check out our how-to blog posts here.
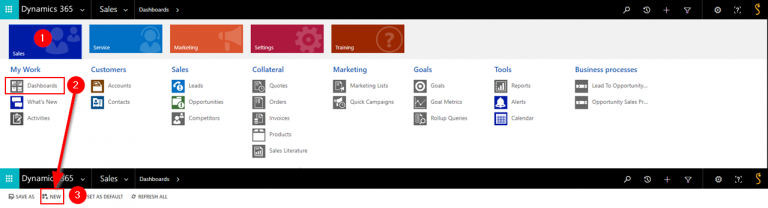
1. Choose a layout
First of all, you’ll need to go to the Dashboard section of Dynamics 365 and click New.
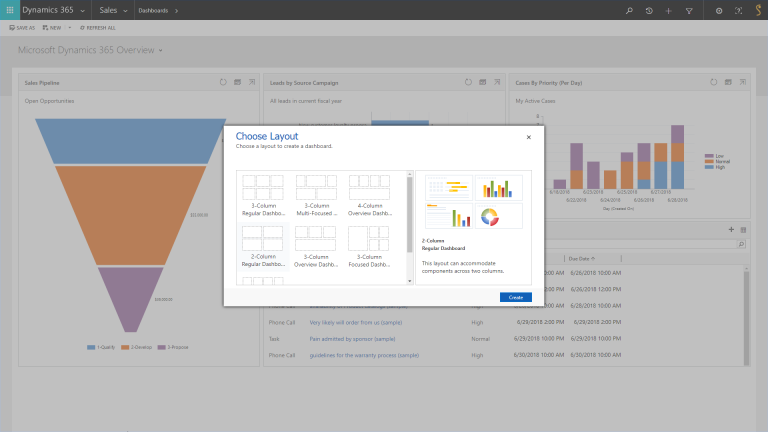
Then, you’ll be asked to choose from different layouts, which is the way your dashboard displays things like graphics, charts, and numbers. You should consider picking one that you think will best serve your vision and goal for this dashboard. It’s also a good idea, at this step, to give a short descriptive name to your dashboard, which in this case would be, “Daily Marketer”.
2. Create a view
After that, you can create a view to manage the data that you want to display in your Daily Marketer dashboard in Microsoft Dynamics 365. This will be used when creating or setting up charts.
Why is this important? Because it helps you set up filters for the data you want to see. This can be dates, fields, or any kind of advanced filter, really.
Keep in mind that it’s possible to create multiple views for the same data if you want to track time values like Monthly Sales VS Yearly Sales.
So, to create a view: you’ll need to select New System View and in the View Properties, you’ll need to give a Name and (not essential, but useful) Description. You can then choose and configure columns, edit the filter criteria, and even configure sorting. When you’re done, Select Save and Close. Don’t forget to press Publish All Customizations.
3. Choose system charts or create your own in Dynamics 365
The difference between the System Charts and the Personal Charts is that the former are charts provided by Microsoft Dynamics 365. They’re out of the box versions. The latter are customized according to your specific needs and strategy.
How to do it?
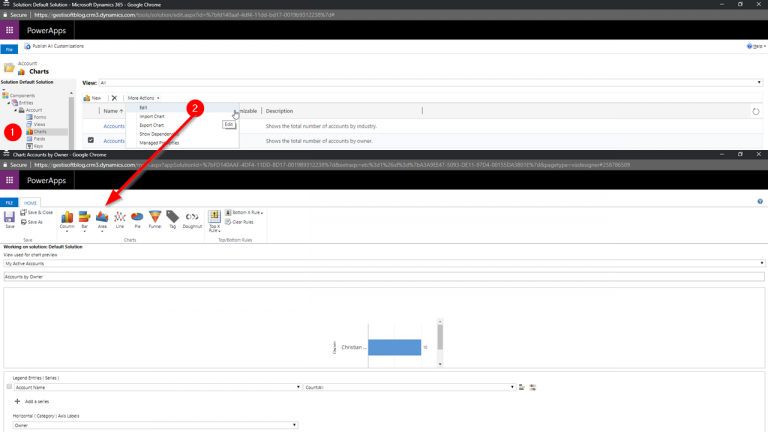
If you want to customize a system chart or create a new one in your dashboard in Microsoft Dynamics 365, you’ll need to go into the Settings bar, click on Customization, then Customize the System. In the Entities drop down menu, you’ll find Charts. On the interface, find the charts you want to personalize or create a new one. This is where you’ll be able to customize almost anything according to your needs and preferences.

If you want to customize your personal chart, just open a view and click on the charts panel on the far right. Choose the chart you want to modify and then click on the Edit Chart button. Modify all the properties you want, and that’s it!
Need more info? Connect your daily marketer dashboard with Power BI in Dynamics 365
Power BI is a business intelligence tool from Microsoft, and it’s honestly brilliant. With its powerful analytical app, its valuable insights, and in-depth reports, it’s the software to get if you want to go further with your dashboard. The beauty of it? It can integrate with a wide range of tools you already use.

As you can see, there’s so much you can do with your Daily Marketer dashboard in Microsoft Dynamics 365. Since you use numerous tools to get your funnel, your ads, and your web marketing up and running, not all the dashboards will enable you to get the numbers across all the software you use. With Power BI, you’ll be able to get information from all your marketing automation tools AND Google Analytics because they can all be integrated.
This way, your daily marketer dashboard can really give you an in-depth and complete overview of your performance. You’ll see, your marketing will have no secrets anymore. You’ll be able to consolidate everything under the same interface and get to work on pressing issues more quickly with an instant overview of your performance. No more data spread across multiple platforms, and no more being lost in a sea of numbers. Your day will start with a straight answer from now on.
Liked what you just read? Sharing is caring.

May 30, 2025 by Kooldeep Sahye by Kooldeep Sahye Marketing Specialist
Fuelled by a passion for everything that has to do with search engine optimization, keywords and optimization of content. And an avid copywriter who thrives on storytelling and impactful content.

